Creating Key Performance Indicator Tags
This topic is only applicable to analytical services. For KPIs in non-analytical services in SAP Fiori elements for OData V4, see Creating Key Performance Indicators.
KPIs in analytical services with a parametrized entity set are not supported in SAP Fiori elements for OData V4.
Each KPI can have its own OData source, entity set, and annotation file. The KPI value changes if an action is executed on the transactional content. For example, releasing sales orders affects a related KPI and posting an accounting document affects certain financial KPIs.
Hover over each action for a description. Click the action for more information.
Manifest Settings: KPI Configuration
SAP Fiori elements for OData V2
Property: keyPerformanceIndicators
Use the UI.KPI annotation to display KPIs in your analytical list page application (in the title area or below the filter bar, depending on
the value of the filterable setting). Define the
manifest.json
file with a qualifier and map it to the UI.KPI annotation. If this annotation isn't configured, then the UI.SelectionPresentationVariant
annotation with the same qualifier name takes effect.
We recommend using a single SAP-wide KPI gallery based on the KPIs generated by standard SAP KPI creation tools, such as the SAP Smart Business framework.
manifest.json
"sap.ui.generic.app":{
   "pages":[
      {
         "entitySet":"SEPMRA_C_ALP_SlsOrdItemCube",
         "component":{
            "name":"sap.suite.ui.generic.template.AnalyticalListPage",
            "list":true,
            "settings":{
               "keyPerformanceIndicators":{
                  "KPIRevenue":{
                     "model":"kpi",
                     "entitySet":"SEPMRA_C_ALP_TotalSalesKPI",
                     "qualifier":"KPIQuantity",
                     "detailNavigation":"EPMProduct"
                  }
            }
      }
},
SAP Fiori elements for OData V4
Property: keyPerformanceIndicators
Use the UI.KPI annotation to display KPIs in your analytical list page application for the title area. Define the
manifest.json
file with a qualifier and map it to the UI.KPI annotation. If this annotation isn't configured, then the
UI.SelectionPresentationVariant annotation with the same qualifier name takes effect.
manifest.json
"sap.ui5": {
    "routing": {
        "targets": {
            "BusinessPartnersALP": {
                "type": "Component",
                "id": "BusinessPartnersList",
                "name": "sap.fe.templates.ListReport",
                "options": {
                    "settings": {
                        "keyPerformanceIndicators": {
                            "KPIRevenue": {
                                "entitySet": "BusinessPartners",
                                "qualifier": "KPIQuantity"
                            },
                            "KPIVolume": {
                                "entitySet": "BusinessPartners",
                                "qualifier": "Volume",
                                "detailNavigation": "PartnerSales"
                            }
                        }
                    }
                }
            }
        }
    }
}
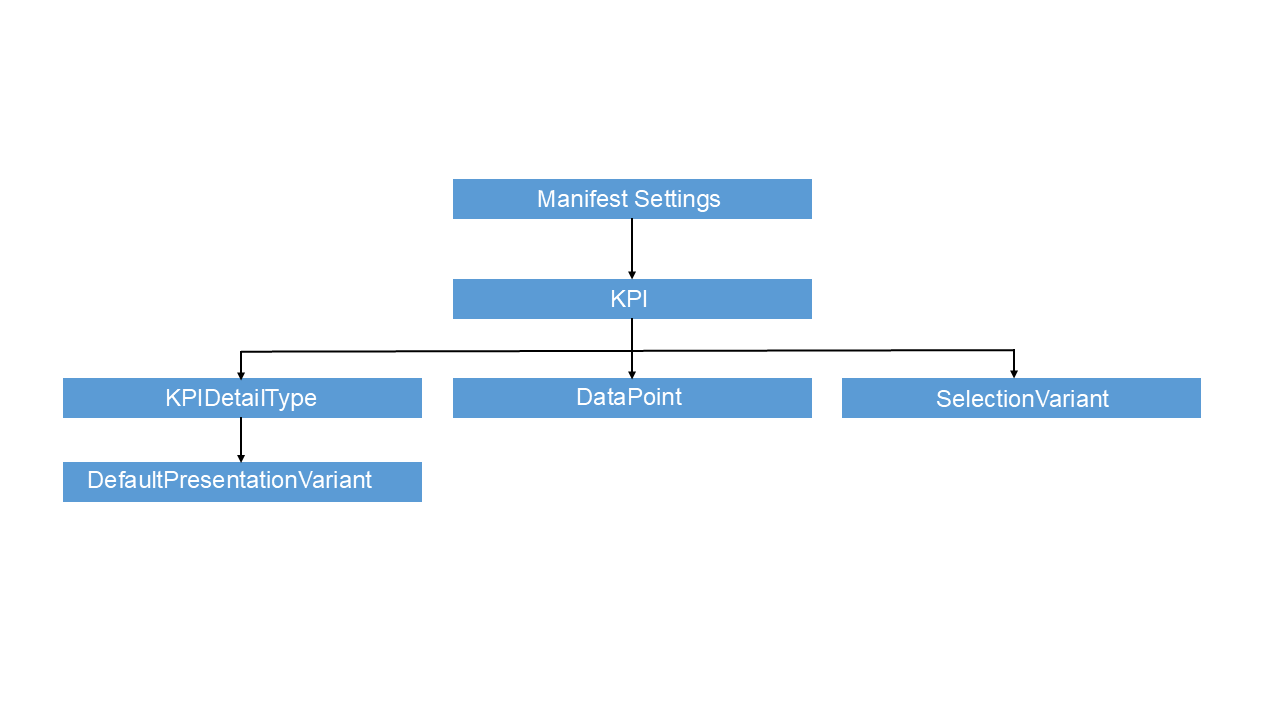
Annotation: UI.KPI annotation with the qualifier KPIQuantity
XML Annotation
<Annotation Term="UI.KPI" Qualifier="KPIQuantity">
   <Record>
      <PropertyValue Property="DataPoint" Path="@UI.DataPoint#DPForQuantity" />
      <PropertyValue Property="SelectionVariant" Path="@UI.SelectionVariant#SVForQuantity" />
      <PropertyValue Property="ID" String="ActualCostByGLAccountNameKPI" />
      <PropertyValue Property="Detail">
         <Record Type="UI.KPIDetailType">
            <PropertyValue Property="SemanticObject" String="EPMProduct" />
            <PropertyValue Property="Action" String="manage_stta" />
            <PropertyValue Property="DefaultPresentationVariant" Path="@UI.PresentationVariant#PVForQuantity" />
         </Record>
      </PropertyValue>
   </Record>
</Annotation>ABAP CDS Annotation
@UI.KPI: [
  {
    selectionVariantQualifier: 'SVForQuantity',
    id: 'ActualCostByGLAccountNameKPI',
    dataPoint.title: 'Define datapoint inline',
    datapoint.minimumValue: 2,
    detail: {
      semanticObject: 'EPMProduct',
      semanticObjectAction: 'manage_stta',
      defaultPresentationVariantQualifier: 'PVForQuantity'
    },
    qualifier: 'KPIQuantity'
  }
]
DPForQuantity;CAP CDS Annotation
UI.KPI #KPIQuantity : {
    DataPoint : ![@UI.DataPoint#DPForQuantity],
    SelectionVariant : ![@UI.SelectionVariant#SVForQuantity],
    ID : 'ActualCostByGLAccountNameKPI',
    Detail : {
        $Type : 'UI.KPIDetailType',
        SemanticObject : 'EPMProduct',
        Action : 'manage_stta',
        DefaultPresentationVariant : ![@UI.PresentationVariant#PVForQuantity]
    }
},
To enable navigation for a KPI card, you need to define the semantic object, action, and KPI ID in the UI.KPI annotation. The KPI ID is
passed to the target application as an EvaluationId for launching the SAP Smart Business application.
Annotation: KPIDetailType
<PropertyValue Property="Detail">
   <Record Type="UI.KPIDetailType">
      <PropertyValue Property="SemanticObject" String="EPMProduct" />
      <PropertyValue Property="Action" String="manage_stta" />
      <PropertyValue Property="DefaultPresentationVariant" Path="@UI.PresentationVariant#PVForQuantity" />
   </Record>
</PropertyValue>
Annotation: DataPoint
DataPoint annotation with the qualifier
DPForQuantity
<Annotation Term="com.sap.vocabularies.UI.v1.DataPoint" Qualifier="DPForQuantity">
   <Record Type="com.sap.vocabularies.UI.v1.DataPointType">
      <PropertyValue Property="Title" String="Quantity by Customer Company Name" />
      <PropertyValue Property="Description" String="About NumberOfSalesOrders" />
      <PropertyValue Property="Value" Path="Quantity" />
      <PropertyValue Property="Criticality" EnumMember="com.sap.vocabularies.UI.v1.CriticalityType/Neutral" />
   </Record>
</Annotation>
Annotation: SelectionVariant with the qualifier SVForQuantity
Description: Configure this annotation for filters and parameters to provide default values for the corresponding filter fields. This configuration overrides
the default values from the Common.FilterDefaultValue annotation. You get the filters from the
SelectionVariant.SelectOptions and the parameters from the SelectionVariant.Parameters.
XML Annotation
<Annotation Term="UI.SelectionVariant" Qualifier="SVForQuantity">
   <Record>
      <PropertyValue Property="Parameters">
         <Collection>
            <Record Type="UI.Parameter">
               <PropertyValue Property="PropertyName" PropertyPath="CompanyCurrency" />
               <PropertyValue Property="PropertyValue" String="EUR" />
            </Record>
         </Collection>
      </PropertyValue>
      <PropertyValue Property="SelectOptions">
         <Collection>
            <Record Type="UI.SelectOptionType">
               <PropertyValue Property="PropertyName" PropertyPath="MainProductCategory" />
               <PropertyValue Property="Ranges">
                  <Collection>
                     <Record Type="UI.SelectionRangeType">
                        <PropertyValue EnumMember="UI.SelectionRangeSignType/I" Property="Sign" />
                        <PropertyValue EnumMember="UI.SelectionRangeOptionType/EQ" Property="Option" />
                        <PropertyValue Property="Low" String="Computer Systems" />
                     </Record>
                  </Collection>
               </PropertyValue>
            </Record>
         </Collection>
      </PropertyValue>
   </Record>
</Annotation>ABAP CDS Annotation
@UI.selectionVariant: [
  {
    qualifier: 'SVForQuantity',
    parameters: [{name: 'PropertyName', value: 'CompanyCurrency' },{ name: 'PropertyValue', value: 'EUR'}]
  }
]
CAP CDS Annotation
UI.SelectionVariant #SVForQuantity : {
    Parameters : [
        {
            $Type : 'UI.Parameter',
            PropertyName : CompanyCurrency,
            PropertyValue : 'EUR'
        },
    ],
    SelectOptions : [
        {
            $Type : 'UI.SelectOptionType',
            PropertyName : MainProductCategory,
            Ranges : [
                {
                    $Type : 'UI.SelectionRangeType',
                    Sign : #I,
                    Option : #EQ,
                    Low : 'Computer Systems'
                }
            ]
        }
    ]
}
Annotation: PresentationVariant annotation with the qualifier PVForQuantity
XML Annotation
<Annotation Term="com.sap.vocabularies.UI.v1.PresentationVariant" Qualifier="PVForQuantity">
   <Record>
      <PropertyValue Property="SortOrder">
         <Collection>
            <Record Type="Common.SortOrderType">
               <PropertyValue Property="Property" PropertyPath="Quantity" />
               <PropertyValue Property="Descending" Bool="true" />
            </Record>
         </Collection>
      </PropertyValue>
      <PropertyValue Property="Visualizations">
         <Collection>
            <AnnotationPath>@com.sap.vocabularies.UI.v1.Chart#QuantityChart</AnnotationPath>
         </Collection>
      </PropertyValue>
   </Record>
</Annotation>
ABAP CDS Annotation
@UI.PresentationVariant: [
  {
    sortOrder: [
      {
        by: 'QUANTITY',
        direction: #DESC
      }
    ],
    visualizations: [
      {
        type: #AS_CHART,
        qualifier: 'QuantityChart'
      }
    ],
    qualifier: 'PVForQuantity'
  }
]
annotate view VIEWNAME with {

}
CAP CDS Annotation
UI.PresentationVariant #PVForQuantity : {
    SortOrder : [
        {
            $Type : 'Common.SortOrderType',
            Property : Quantity,
            Descending : true
        },
    ],
    Visualizations : [
        '@UI.Chart#QuantityChart'
    ]
}
Chart annotation with the qualifier QuantityChart
XML Annotation
<Annotation Term="com.sap.vocabularies.UI.v1.Chart" Qualifier="QuantityChart">
   <Record>
      <PropertyValue Property="Title" String="NumberOfSalesOrders" />
      <PropertyValue Property="MeasureAttributes">
         <Collection>
            <Record Type="com.sap.vocabularies.UI.v1.ChartMeasureAttributeType">
               <PropertyValue Property="Measure" PropertyPath="Quantity" />
               <PropertyValue Property="Role" EnumMember="com.sap.vocabularies.UI.v1.ChartMeasureRoleType/Axis1" />
            </Record>
         </Collection>
      </PropertyValue>
      <PropertyValue Property="DimensionAttributes">
         <Collection>
            <Record Type="com.sap.vocabularies.UI.v1.ChartDimensionAttributeType">
               <PropertyValue Property="Dimension" PropertyPath="SoldToPartyCompanyName" />
               <PropertyValue Property="Role" EnumMember="com.sap.vocabularies.UI.v1.ChartDimensionRoleType/Category" />
            </Record>
         </Collection>
      </PropertyValue>
      <PropertyValue Property="ChartType" EnumMember="UI.ChartType/Bar" />
      <PropertyValue Property="Description" String="NumberOfSalesOrders by Customer Company Name" />
   </Record>
</Annotation>
CABAP CDS Annotation
@UI.Chart: [
  {
    title: 'NumberOfSalesOrders',
    measureAttributes: [
      {
        measure: 'Quantity',
        role: #AXIS_1
      }
    ],
    dimensionAttributes: [
      {
        dimension: 'SoldToPartyCompanyName',
        role: #CATEGORY
      }
    ],
    chartType: #BAR,
    description: 'NumberOfSalesOrders by Customer Company Name',
    qualifier: 'QuantityChart'
  }
]
annotate view VIEWNAME with {

}
CAP CDS Annotation
UI.Chart #QuantityChart : {
    Title : 'NumberOfSalesOrders',
    MeasureAttributes : [
        {
            $Type : 'UI.ChartMeasureAttributeType',
            Measure : Quantity,
            Role : #Axis1
        },
    ],
    DimensionAttributes : [
        {
            $Type : 'UI.ChartDimensionAttributeType',
            Dimension : SoldToPartyCompanyName,
            Role : #Category
        },
    ],
    ChartType : #Bar,
    Description : 'NumberOfSalesOrders by Customer Company Name'
}
Note the following for SAP Fiori elements for OData V4:
-
Only the chart types line, column, bar, stacked bar, stacked column, vertical_bullet, scatter, combination, donut, and bubble are supported.
-
Only the
SortOderandMaxItemsparameters from thePresentationVariantare considered.
KPI Titles
The abbreviation of the KPI title is based on the following logic:
|
If a KPI name is |
Abbreviation is based on |
Example |
|---|---|---|
|
One word |
First three letters |
KPI Name: TargetMargin KPI Title: TAR |
|
Two words |
First letter of each word |
KPI Name: Actual Cost KPI Title: AC |
|
Three words or more |
First letter of first three words |
KPI Name: Actual Margin Relative KPI Title: AMR |
The KPI name is taken from the Title property of the
DataPoint annotation.
KPI Value and Color
Use the UI.KPI annotation to render KPI values and to determine the
KPI's color. This annotation is associated with the
SelectionVariant and
DefaultPresentationVariant.
The first DataPoint visualization element in the
PresentationVariant renders the KPI value and determines the
KPI's color. If a KPI is percent-based, then the percent sign %
appears along with the KPI value.
Click the KPI title or value to view more details on a KPI card.
The color of the KPI value depends on the threshold values. To define the threshold
values, use these properties in the DataPoint annotation:
CriticalityCalculation: Allows you to hard code values or to include the value from a property path- Criticality: Allows complex back-end logic to specify the criticality values
If you use both properties in the annotation, then the criticality value overrides
the CriticalityCalculation value.
The color logic depends on the measure type. You can choose a maximizing measure,
minimizing measure, or range-based measure types based on the
"ImprovementDirection" value of the measure.
- Target Measure: Hover over each item to view the conditions.
This image is interactive. Hover over each area for a description.

- Maximizing Measure: Hover over each item to view the conditions.
This image is interactive. Hover over each area for a description.

- Minimizing Measure: Hover over each item to view the conditions.
This image is interactive. Hover over each area for a description.

If the threshold values are insufficient or incorrect, the ALP chooses the closest
color match for a KPI value. For example, if a target KPI has the
DataPoint.Value aggregate <
ThresholdValues.ToleranceRangeLowValue and doesn't have a
value for ThresholdValues.DeviationRangeLowValue, then the KPI
value has the color for a critical condition.
The criticality indicator line in a KPI tag also takes the same color as the KPI value.
Scale, Decimal Precision, and Number Formatting
The SAPUI5 formatter returns the scale factor and decimal factor for a KPI value.
The NumberOfFractionalDigits information can be provided in the
com.sap.vocabularies.UI.v1.DataPoint term, using the
ValueFormat property. The
NumberOfFractionalDigits property is used to determine the
number of fraction digits. The rules are as follows:
-
Decimals aren't shown by default.
-
You can specify 1 or 2 decimal places by using the
NumberOfFractionalDigitsproperty in annotations. If a value higher than 2 is provided, it is considered in addition to 2.
In the following example, the "Price" property for the
NumberOfFractionalDigits provided in the OData metadata - 3 is
overridden with the value 1, as provided in the com.sap.vocabularies.UI.v1.DataPoint
ValueFormat property:
XML Annotation
<Annotation Term="com.sap.vocabularies.UI.v1.DataPoint" Qualifier="Price">
    <Record Type="com.sap.vocabularies.UI.v1.DataPointType">
        <PropertyValue Property="Value" Path="Price"/>
        <PropertyValue Property="ValueFormat">
            <Record Type="com.sap.vocabularies.UI.v1.NumberFormat">
                <PropertyValue Property="NumberOfFractionalDigits" Int="1"/>
            </Record>
        </PropertyValue>
    </Record>
</Annotation>
ABAP CDS Annotation
@UI.dataPoint: {
   valueFormat.numberOfFractionalDigits: 1
}
price;
CAP CDS Annotation
UI.DataPoint #Price : {
    $Type : 'UI.DataPointType',
    Value : Price,
    ValueFormat : {
        $Type : 'UI.NumberFormat',
        NumberOfFractionalDigits : 1
    }
}
Display KPI Tags with Units of Measure
The global and filterable KPIs in the ALP can now display KPI values with a Unit of Measure. For example, to add a Unit of Measure, define a path or string value directly.
XML Annotation
<Annotations Target="CZ_PROJECTKPIS_CDS.CZ_PROJECTKPISType/ActualCost">
        <Annotation Term="Org.OData.Measures.V1.ISOCurrency" Path="CompanyCodeCurrency"/>
</Annotations>
<Annotations Target="CZ_PROJECTKPIS_CDS.CZ_PROJECTKPISType/TargetMargin">
        <Annotation Term="Org.OData.Measures.V1.ISOCurrency" String="EUR"/>
</Annotations>
<Annotations Target="CZ_PROJECTKPIS_CDS.CZ_PROJECTKPISType/ActualMarginRelative">
        <Annotation Term="Org.OData.Measures.V1.Unit" String="%"/>
</Annotations>
<Annotations Target="CZ_PROJECTKPIS_CDS.CZ_PROJECTKPISType/NetWeight">
        <Annotation Term="Org.OData.Measures.V1.Unit" Path="WeightUnit"/>
</Annotations>CAP CDS Annotation
annotate CZ_PROJECTKPIS_CDS.CZ_PROJECTKPISType with {
  @Measures.ISOCurrency : CompanyCodeCurrency
  ActualCost
};
You can override a unit of measure that comes from the back end. For example, the following annotation configuration overrides the unit of measure from the back end and changes it to a percentage-based unit of measure.
<Annotations Target="CZ_PROJECTKPIS_CDS.CZ_PROJECTKPISType/ActualCost">
     <Annotation Term="Org.OData.Measures.V1.Unit" String="%"/>
</Annotations>
Filterable KPIs
The filterable KPIs react to filter bar changes when there's an exact match between the technical name, modified filter, and parameter field in the filter bar and in the KPI's entity set.
-
Filterable KPIs are only available in SAP Fiori elements for OData V2.
-
If the default filter values specified in the
SelectionVariantannotation are also part of the filter bar fields, then the filter bar values override theSelectionVariantannotation default values. Otherwise, they're applied in addition to the filter bar values. -
The ALP ignores the
UI.Hiddenfields on filter selection for filterable KPIs, if the filter field coming from filter bar is marked asUI.Hiddenin the KPI entity set. -
If
showGoButtonOnFilterBarisTrue, the filterable KPIs are hidden until the Go option is chosen. If Apply Automatically is checked, filterable KPIs are displayed on load of the application.
To ensure that KPIs show up as filterable, set "filterable"=true in the
manifest.json
file.
manifest.json
"sap.ui.generic.app":{
   "pages":[
      {
         "entitySet":"SEPMRA_C_ALP_SlsOrdItemCube",
         "component":{
            "name":"sap.suite.ui.generic.template.AnalyticalListPage",
            "list":true,
            "settings":{
               "keyPerformanceIndicators":{
                  "KPIRevenue":{
                     "model":"kpi",
                     "entitySet":"SEPMRA_C_ALP_TotalSalesKPI",
                     "qualifier":"KPIRevenue",
                     "filterable":true,
                     "detailNavigation":"OverviewPage"
                  }
            }
      }
},
Semantic Coloring for Filterable KPIs
If CriticalityCalculation is defined in the annotations,
filterable KPIs are updated based on a change to the filter or parameter. If the
values come from a path, then criticality indicators change based on the KPI
value.
Only path-based is supported for filterable KPIs and semantic coloring depends on the changes to the filter bar.