Multiple Views on List Report Tables
By default, the list report displays only one table. You can define multiple views of a table, and add a chart, if
required.
We've removed videos showing step-by-step procedures using SAP Web IDE, which SAP
no longer actively supports. You can still access the video using an older version of this document.
You can define variants for specific selections of data on the user interface, for
example, based on filter settings. In the definition dialog, these variants are
called views, however, the feature is called variant management. Therefore, for
clarity, we use the term variant management in this section.
You have the following options:
-
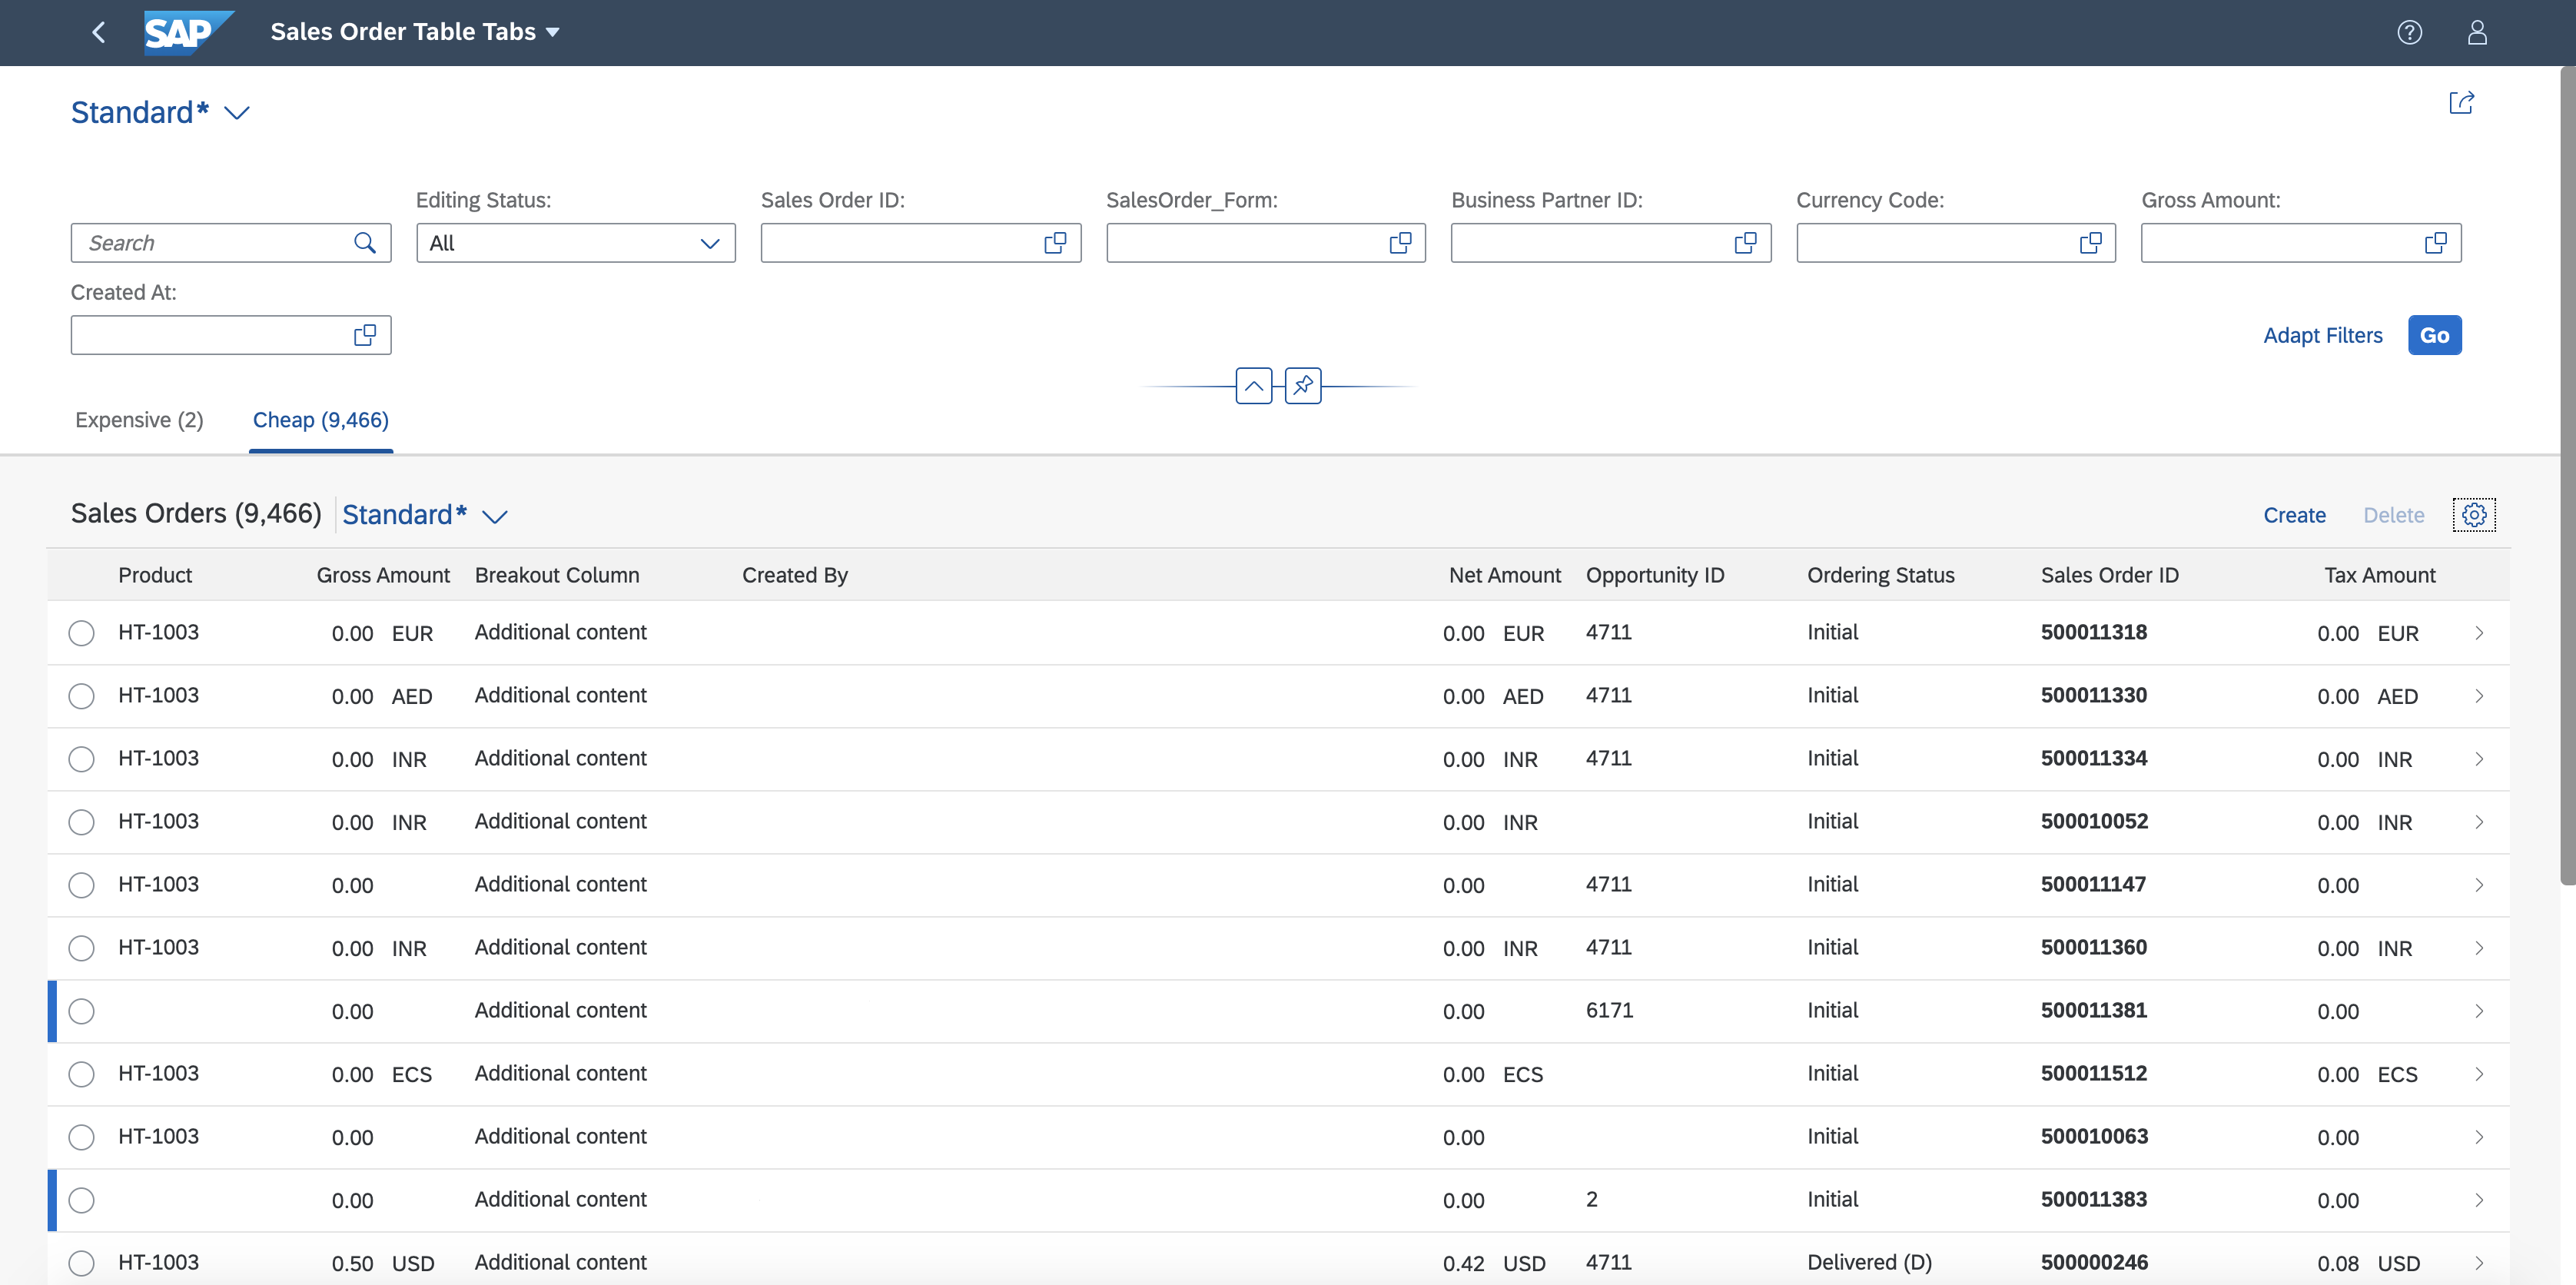
A single table for all views ("single table mode"): The UI contains a single table instance, one table
toolbar, and (if activated) one table variant management. To switch between the views, a segmented button is rendered in the
table toolbar. If there are more than three views, a select control is rendered instead of a segmented button.
-
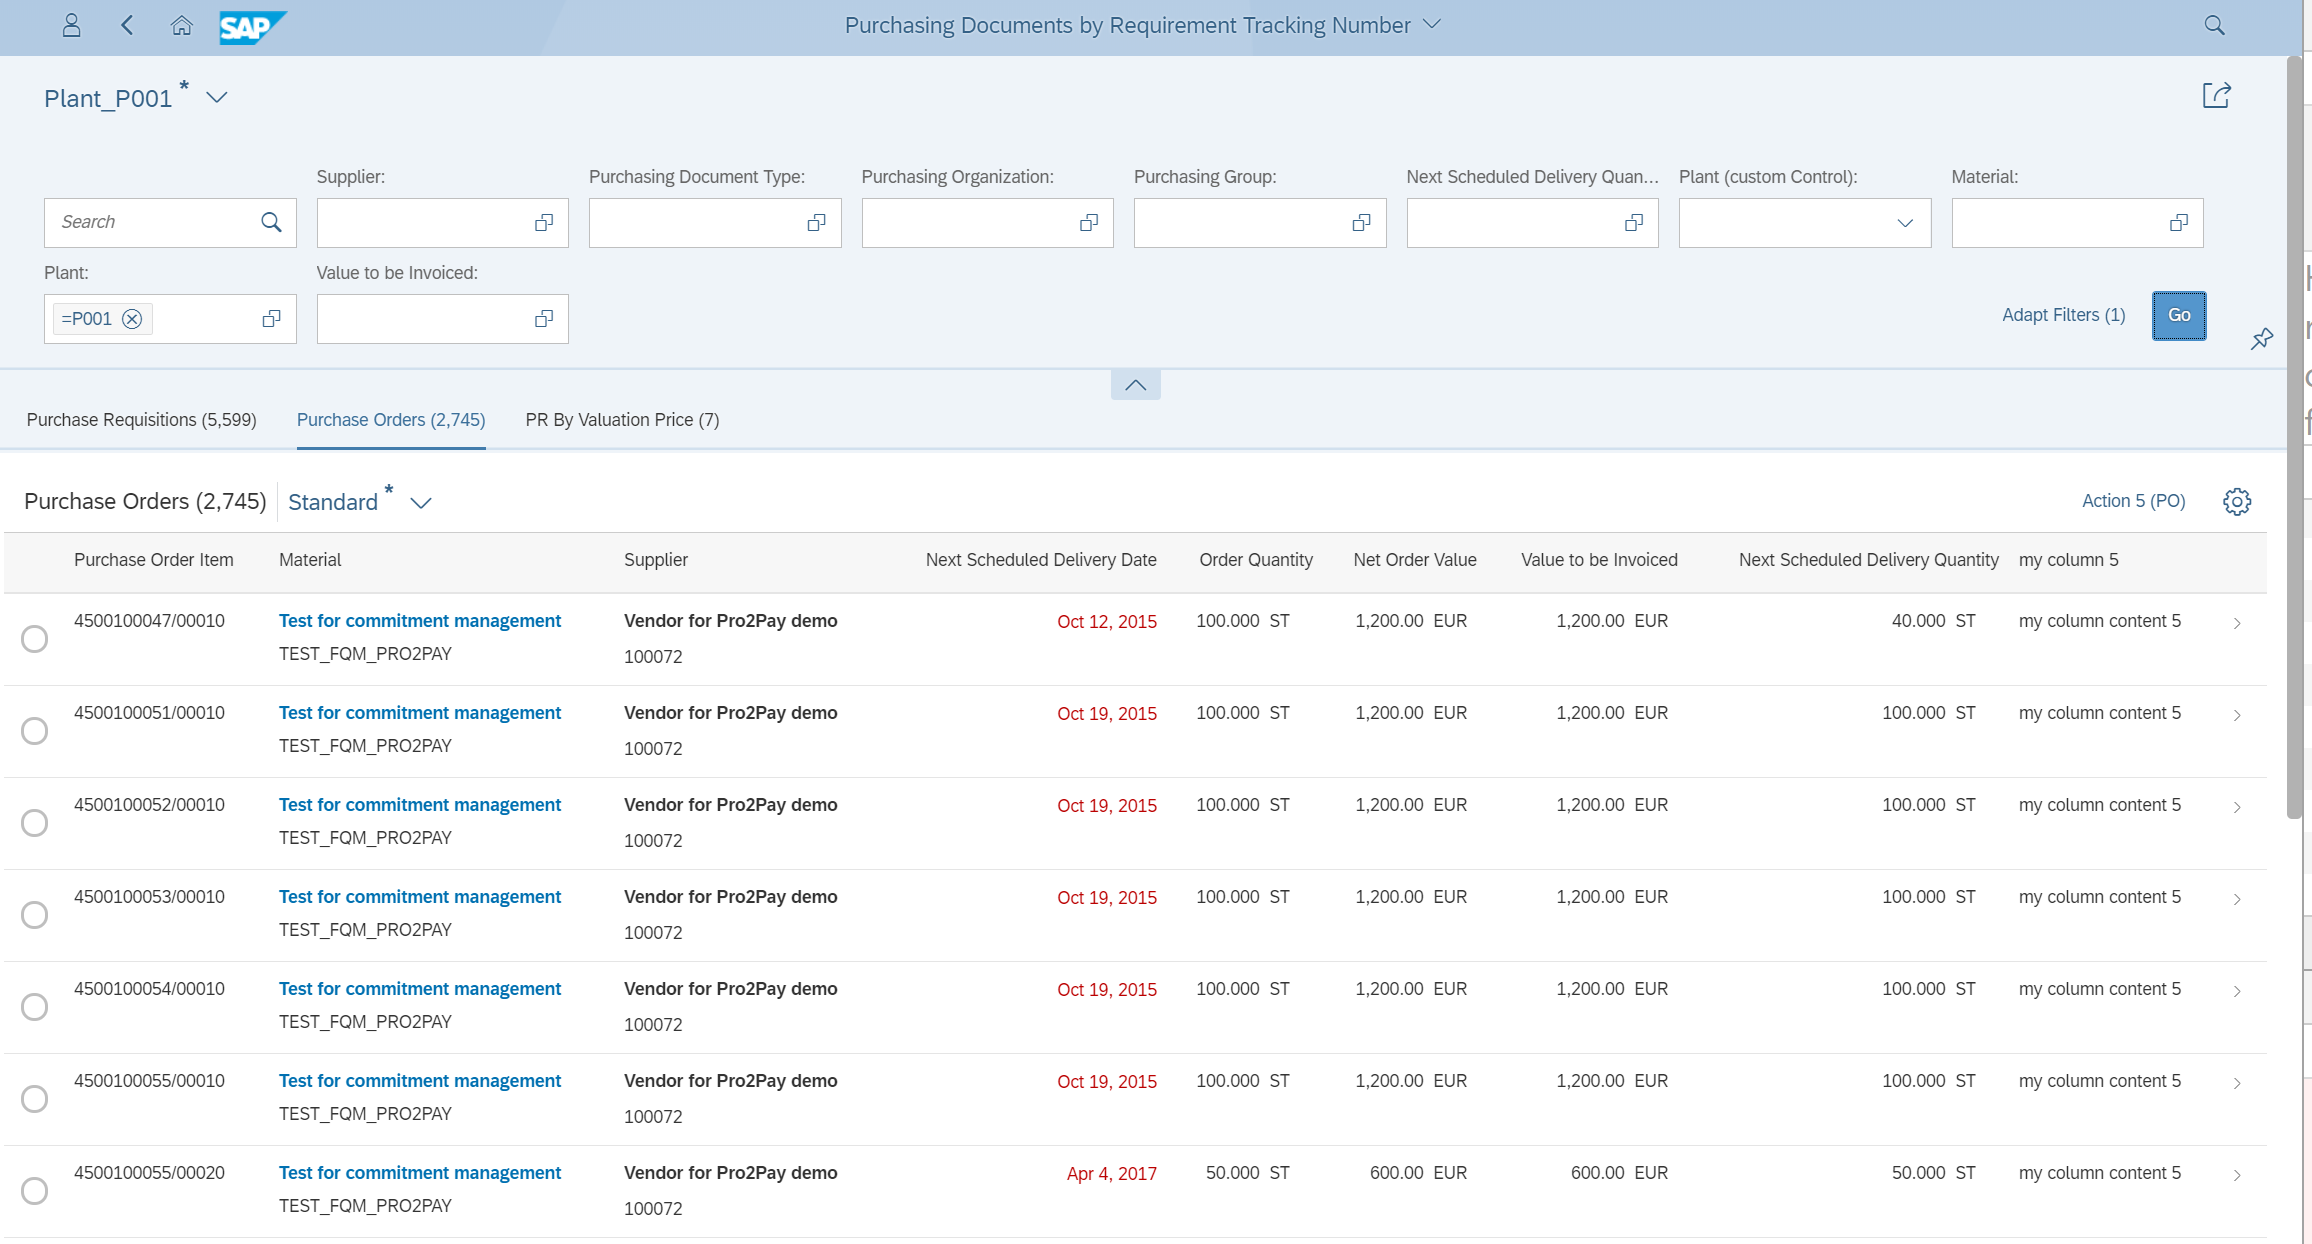
A separate table for each view ("multiple table mode"): If there are n views, the UI contains n table
instances. This results in n separate table toolbars and n separate table variant managements. An icon tab bar is rendered
above the table for switching between the views (table instances). Only the table on the currently selected tab is
visible.
If a property used in multiple views is not listed in the SelectionFields
, you need to remove the property in the
FilterBar
. Users should not be able to add it using the adapt filter.
Which Annotations Should I Use?
-
If you only want to describe which data should be displayed in a view, you can define a
SelectionVariant
containing filter criteria for the data. See Defining Multiple Views on a List Report Table - Single Table Mode.
-
If you also want to describe how the data should be displayed (for example, different sort orders in a
table or a different visualization in a table), you can define a SelectionPresentationVariant
. Note that you
can use this annotation only for multiple table mode and multiple table mode with charts. See Defining Multiple Views on a List Report Table - Multiple Table Mode.
-
If all you want to do is use a different visualization, you can define a
PresentationVariant
.
-
In multiple table mode, in addition to tables, you can also display charts on specific tab pages.
Multiple Table Mode with Charts
Additional Features in SAP Fiori Elements for OData V2
-
On each tab, you can also display data for different entity sets, for example, a sales order or a supplier. To do so, add
the entity set to the corresponding tab in the manifest.
Multiple views on a list report with different entity sets
You can't use StandardList
nor ObjectList
in the multiple view scenario.
Additional Features in SAP Fiori Elements for OData V4
By default, the icon tab bar for multiple views remains visible while scrolling. You can hide it by setting
stickyMultiTabHeader
to false
.
Additionally, you can control the visibility of the view by setting the
"visible"
property, which can be one of the following:
For more information about the syntax of a binding expression, see Expression Binding.
Make the settings as shown in the following sample code:
manifest.json
Hidden
"targets": {
"DraftList": {
"type": "Component",
"id": "DraftList",
"name": "sap.fe.templates.ListReport",
"options": {
"settings": {
"contextPath": "/FirstDraft",
"variantManagement": "Control",
"initialLoad": "Enabled",
"stickyMultiTabHeader": false,
"views": {
"paths": [
{
"key": "tab1",
"annotationPath": "com.sap.vocabularies.UI.v1.SelectionVariant#One",
"visible": "{= ${/MySingleton/IsViewAvailable} === true}"
},
{
"key": "tab2",
"contextPath": "/SecondDraft",
"annotationPath": "com.sap.vocabularies.UI.v1.SelectionVariant#Two"
}
]
}
}
…
}
}
}
…
You can also define and configure custom views for a list report using a controller extension. For more information, see Extension Points for Views in the List Report.
SAP Fiori elements for OData
V4 refreshes the content of a view and the counts for each
view:
In addition, you can control the view and count refresh using the following dedicated APIs:
Check out our live example in the flexible programming model explorer at Multi Mode Extensibility.
Adding Multiple Views to a List Report Page Using SAP Fiori Tools
Find out how to add multiple views to a list report page using SAP Fiori tools.
- Launch the Page Map. You can launch the Page Map in several ways, for example
by right-clicking the project folder and selecting Show Page Map. For more information, see Define Application Structure.
- Launch the Page Editor for your list report page. Click the (Edit) icon next to List Report.
- Click the (Add) icon next to Views.
- Click Add Table View.
- Select an Entity.
- Click Add.
- Expand the new table view node.
- Click the (Add) icon next to Columns.
- Click Add Basic Columns.
- Select the columns you wish to include.
- Click Add.
- Click the new view node.
- Provide a new value for the View Label to rename the new view.
- To preview your new view, see Previewing an Application.
The following screen recording shows how to add a new view:
Open this video in a new window
Parent topic:
Previous:
Next: