Adding a Progress Indicator to a Table
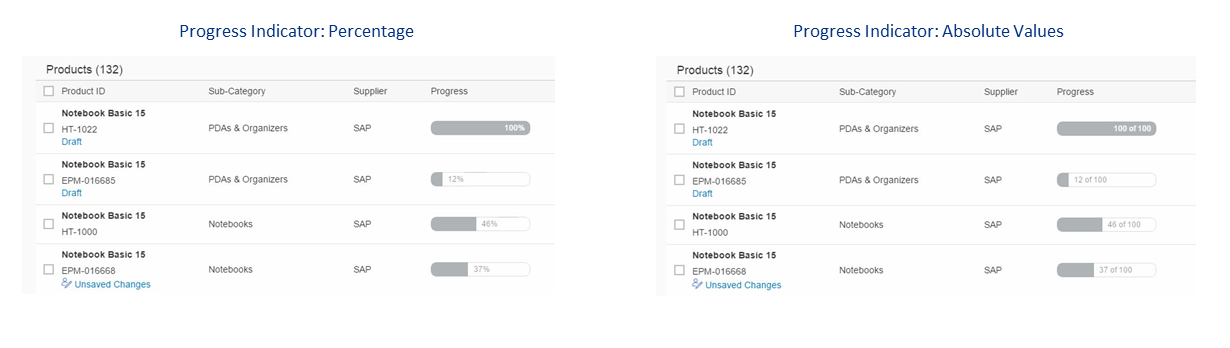
The progress indicator allows you to visually represent the level of completion of a project or a goal, for example.
It can be used to express completion values either as a percentage or as absolute numbers (for example, 8 of 10).
Code Samples
The following code sample shows how to implement a progress indicator using
annotations. AnnotationPath="@UI.DataPoint#Progress references the
Qualifier="Progress".
EnumMember="UI.VisualizationType/Progress" defines the actual
visualization as a progress indicator.
XML Annotation
<Annotations Target="STTA_PROD_MAN.STTA_C_MP_ProductType">
    <Annotation Term="UI.DataPoint" Qualifier="Progress">
        <Record>
            <PropertyValue Property="Value" Path="to_StockAvailability/Quantity" />
            <PropertyValue Property="TargetValue" Decimal="100" />
            <PropertyValue Property="Visualization" EnumMember="UI.VisualizationType/Progress" />
        </Record>
    </Annotation>
    <Annotation Term="UI.LineItem">
        <Collection>
            <Record Type="UI.DataFieldForAnnotation">
                <PropertyValue Property="Label" String="Progress" />
                <PropertyValue Property="Criticality" Path="to_StockAvailability/Quantity" />
                <PropertyValue Property="Target" AnnotationPath="@UI.DataPoint#Progress" />
            </Record>
        <Collection>
    </Annotation>
</Annotations>
ABAP CDS Annotation
annotate view STTA_C_MP_StockAvailability with {
  @UI.dataPoint: { targetValue: 100, visualization: #PROGRESS }
  Quantity;
}


@UI.lineItem: [
  {
    label: 'Progress',
    criticality: 'TO_STOCKAVAILABILITY/QUANTITY',
    valueQualifier: 'Progress',
    type: #AS_DATAPOINT
  }
]
progress;CAP CDS Annotation
annotate STTA_PROD_MAN.STTA_C_MP_ProductType @(
  UI.DataPoint #Progress : {
    Value : to_StockAvailability.Quantity,
    TargetValue : 100,
    Visualization : #Progress
  },
  UI.LineItem : [
    {
        $Type : 'UI.DataFieldForAnnotation',
        Label : 'Progress',
        Criticality : to_StockAvailability.Quantity,
        Target : '@UI.DataPoint#Progress',
    }
  ]
);
Change Color of Progress Bar
If required, you can set up the progress bar so that it changes color to reflect the state of the progress depending on the
criticality value as shown in the figure below.
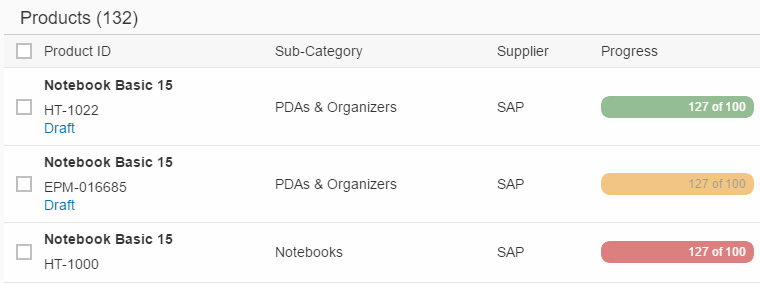
To do so, assign a value to the criticality property.
The path references the property (in this case, Path="StockAvailability") that defines the color.
<Annotation Term="UI.DataPoint" Qualifier="Quantity">
               <Record>
                       <PropertyValue Property="Value" Path="Quantity"/>
                       <PropertyValue Property="Title" String="{@i18n>@Availability}"/>
                       <PropertyValue Property="Description" String="Progress Indicator"/>
                       <PropertyValue Property="TargetValue" Decimal="150"/>
                       <PropertyValue Property="Visualization" EnumMember="UI.VisualizationType/Progress"/>
                       <PropertyValue Property="Criticality" Path="StockAvailability"/>
               </Record>
        </Annotation>