Step 9: Delta Micro Chart
DeltaMicroChart on the
Production Process page.Preview
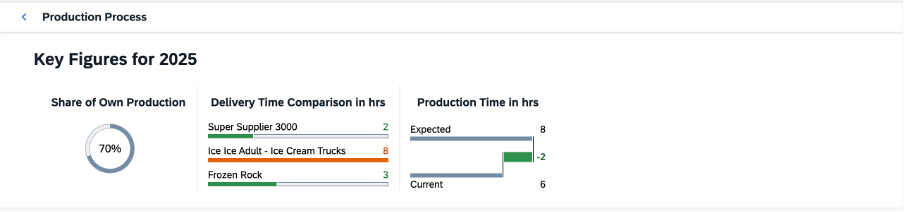
DeltaMicroChart
You can add a chart to visualize the difference between the time required for production compared
with the estimated time. To do so, you can use the DeltaMicroChart
to compare two separate values.
ProcessFlow.view.xml
You can view and download this step in the Demo Kit from the Ice Cream Machine - Step 9 - Delta Micro Chart.
<mvc:View
    ...
                <m:headerContainer>
                    <m:HeaderContainer
                        scrollStep="200"
                        scrollTime="500"
                        showDividers="true"
                        class="sapUiSmallMargin">
                        ...
                        <m:FlexBox
                            width="12rem"
                            height="10rem"
                            alignItems="Center"
                            justifyContent="Center"
                            direction="Column">
                            <m:Title
                                text="{
                                    parts: [
                                    'i18n>processFlowChartsProductionTime',
                                    'business>/timeMeasure'
                                    ],
                                    formatter: '.formatMessage'
                                }"
                                class="sapUiSmallMargin"/>
                            <m:FlexBox width="12rem" height="6rem" renderType="Bare">
                                <mc:DeltaMicroChart
                                    size="Responsive"
                                    color="{business>/productionTimeComparisonCriticality}"
                                    value1="{business>/expectedProductionTime}"
                                    value2="{business>/currentProductionTime}"
                                    title1="{i18n>processFlowChartsExpected}"
                                    title2="{i18n>processFlowChartsCurrent}"
                                    displayValue1="{business>/expectedProductionTime}"
                                    displayValue2="{business>/currentProductionTime}"
                                    deltaDisplayValue="{
                                        parts: [
                                        'business>/expectedProductionTime',
                                        'business>/currentProductionTime'
                                        ],
                                        formatter: '.getValuesDelta'
                                    }"
                                />
                            </m:FlexBox>
                        </m:FlexBox>
                    </m:HeaderContainer>
                </m:headerContainer>
            ...
</mvc:View>
The DeltaMicroChart is used in the responsive mode embedded in the
Flexbox that sets the dimensions. You can use the respective
values from the data model for binding the displayValue1 and
displayValue2 properties. For the
deltaDisplayValue, an advanced calculation must be performed
based on the values before you can set them as a property. In this case, use the
.getValuesDelta formatter function.
ProcessFlow.controller.js
sap.ui.define([
    "sap/ui/core/mvc/Controller",
    "sap/base/strings/formatMessage"
], function (Controller, formatMessage) {
    "use strict";

    return Controller.extend("sap.suite.ui.commons.demokit.tutorial.icecream.09.controller.ProcessFlow", {
        ...getValuesDelta: function (fFirstValue, fSecondValue) {
            return fSecondValue - fFirstValue;
        }
    });
});
This formatter takes the respective values and returns a string that sets a property of the
DeltaMicroChart.
Parent topic: Ice Cream Machine Tutorial
Previous: Step 8: Comparison Micro Chart