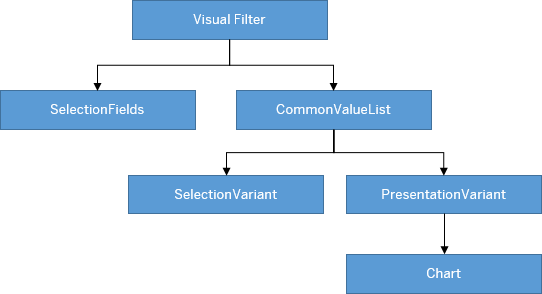
Visual Filters
You can configure visual filters by enhancing the ValueList annotation associated with the filter field. For more information, see Enhancing ValueList Annotations for Visual Filters. This setup supports line and bar charts.
You must ensure that the records available through the value help entity set associated with the visual filter are the same as the records available through the value help entity set associated with the regular filter field. This is required for a smooth sync of the selected values across the different filter modes.
The visual filter includes only the first measure and dimension from the first chart annotation
within the specified
PresentationVariantQualifier.
Ensure that the dimension specified in the chart matches the
ValueListProperty
of the
OUT
parameter. To control the sort order, define a
SortOrder
property in the
PresentationVariant
annotation.
Sorting in visual filters is based on the following logic:
-
For bar charts and donut charts in SAP Fiori elements for OData V2, sorting is always based on the displayed measure, with descending order as the default sort order. To modify the sort order, define the
SortOrderproperty in thePresentationVariantannotation. - For line charts with time-based dimensions, sorting is always based on the dimension displayed in ascending order, however, only the last six time
periods are
displayed.
Sorting by the annotation is ignored for line charts with time-based dimensions in the visual filter.
- For line charts with non time-based dimensions, sorting is always based on the
dimension, with ascending order as the default sort
order. To
modify
the sort order, define the
SortOrderproperty in thePresentationVariantannotation.
Hover over each action for a description. Click the action for more information.
ValueList Annotation
This is an example of a code snippet for a value list annotation. You use it to configure visual filters. For more information, see Enhancing ValueList Annotations for Visual Filters.
XML Annotation
<Annotations xmlns="http://docs.oasis-open.org/odata/ns/edm" Target="SEPMRA_ALP_SO_ANA_SRV.SEPMRA_C_ALP_SlsOrdItemCubeALPResult/SalesOrderOverallStatus">
   <Annotation Term="Common.ValueList" Qualifier="VisualFilter">
      <Record>
         <PropertyValue Property="Label" String="Overall Status" />
         <PropertyValue Property="CollectionPath" String="SEPMRA_C_ALP_SlsOrdItemCubeALPResults" />
         <PropertyValue Property="SearchSupported" Bool="false" />
         <PropertyValue Property="PresentationVariantQualifier" String="FilterNumberOfSalesOrdersByStatus" />
         <PropertyValue Property="SelectionVariantQualifier" String="SVForStatus" />
         <PropertyValue Property="Parameters">
            <Collection>
               <Record Type="Common.ValueListParameterInOut">
                  <PropertyValue Property="LocalDataProperty" PropertyPath="SalesOrderOverallStatus" />
                  <PropertyValue Property="ValueListProperty" String="SalesOrderOverallStatus" />
               </Record>
               <Record Type="Common.ValueListParameterInOut">
                  <PropertyValue Property="LocalDataProperty" PropertyPath="MainProductCategory" />
                  <PropertyValue Property="ValueListProperty" String="MainProductCategory" />
               </Record>
               <Record Type="Common.ValueListParameterInOut">
                  <PropertyValue Property="LocalDataProperty" PropertyPath="ProductCategory" />
                  <PropertyValue Property="ValueListProperty" String="ProductCategory" />
               </Record>
            </Collection>
         </PropertyValue>
      </Record>
   </Annotation>
</Annotations>CAP CDS Annotation
annotate SEPMRA_ALP_SO_ANA_SRV.SEPMRA_C_ALP_SlsOrdItemCubeALPResult with {
  @Common.ValueList #VisualFilter : {
    Label : 'Overall Status',
    CollectionPath : 'SEPMRA_C_ALP_SlsOrdItemCubeALPResults',
    SearchSupported : false,
    PresentationVariantQualifier : 'FilterNumberOfSalesOrdersByStatus',
    SelectionVariantQualifier : 'SVForStatus',
    Parameters : [
        {
            $Type : 'Common.ValueListParameterInOut',
            LocalDataProperty : SalesOrderOverallStatus,
            ValueListProperty : 'SalesOrderOverallStatus'
        },
        {
            $Type : 'Common.ValueListParameterInOut',
            LocalDataProperty : MainProductCategory,
            ValueListProperty : 'MainProductCategory'
        },
        {
            $Type : 'Common.ValueListParameterInOut',
            LocalDataProperty : ProductCategory,
            ValueListProperty : 'ProductCategory'
        }
    ]
  }
  SalesOrderOverallStatus
};
For information about the IN/OUT mapping of visual filters, see Enhancing ValueList Annotations for Visual Filters.
PresentationVariant Qualifier
The PresentationVariant qualifier provides chart definitions for visual filters. The visual filter picks up the first chart annotation in
the PresentationVariant annotation to render the chart. If the chart type
isn't
supported, the
analytical
list page renders a bar chart as the
default chart
type.
XML Annotation
<Annotation Term="UI.PresentationVariant" Qualifier="FilterNumberOfSalesOrdersByStatus">
   <Record>
      <PropertyValue Property="Text" String="Filter: Number of Sales Order by Status" />
      <PropertyValue Property="SortOrder">
         <Collection>
            <Record Type="Common.SortOrderType">
               <PropertyValue Property="Property" PropertyPath="NumberOfSalesOrders" />
               <PropertyValue Property="Descending" Bool="true" />
            </Record>
         </Collection>
      </PropertyValue>
      <PropertyValue Property="Visualizations">
         <Collection>
            <AnnotationPath>@UI.Chart#FilterNumberOfSalesOrdersByStatus</AnnotationPath>
         </Collection>
      </PropertyValue>
   </Record>
</Annotation>ABAP CDS Annotation
@UI.PresentationVariant: [
  {
    text: 'Filter: Number of Sales Order by Status',
    sortOrder: [
      {
        by: 'NUMBEROFSALESORDERS',
        direction: #DESC
      }
    ],
    visualizations: [
      {
        type: #AS_CHART,
        qualifier: 'FilterNumberOfSalesOrdersByStatus'
      }
    ],
    qualifier: 'FilterNumberOfSalesOrdersByStatus'
  }
]
annotate view VIEWNAME with {

}CAP CDS Annotation
UI.PresentationVariant #FilterNumberOfSalesOrdersByStatus : {
    Text : 'Filter: Number of Sales Order by Status',
    SortOrder : [
        {
            $Type : 'Common.SortOrderType',
            Property : NumberOfSalesOrders,
            Descending : true
        },
    ],
    Visualizations : [
        '@UI.Chart#FilterNumberOfSalesOrdersByStatus'
    ]
},
Chart Annotation
XML Annotation
<Annotation Term="UI.Chart" Qualifier="FilterNumberOfSalesOrdersByStatus">
   <Record Type="UI.ChartDefinitionType">
      <PropertyValue Property="Title" String="Sales Orders by Status" />
      <PropertyValue Property="Description" String="Number of Sales Orders by Status" />
      <PropertyValue Property="ChartType" EnumMember="UI.ChartType/Donut" />
      <PropertyValue Property="Dimensions">
         <Collection>
            <PropertyPath>SalesOrderOverallStatus</PropertyPath>
         </Collection>
      </PropertyValue>
      <PropertyValue Property="DimensionAttributes">
         <Collection>
            <Record Type="UI.ChartDimensionAttributeType">
               <PropertyValue Property="Dimension" PropertyPath="SalesOrderOverallStatus" />
               <PropertyValue Property="Role" EnumMember="UI.ChartDimensionRoleType/Category" />
            </Record>
         </Collection>
      </PropertyValue>
      <PropertyValue Property="Measures">
         <Collection>
            <PropertyPath>NumberOfSalesOrders</PropertyPath>
         </Collection>
      </PropertyValue>
      <PropertyValue Property="MeasureAttributes">
         <Collection>
            <Record Type="UI.ChartMeasureAttributeType">
               <PropertyValue Property="Measure" PropertyPath="NumberOfSalesOrders" />
               <PropertyValue Property="Role" EnumMember="UI.ChartMeasureRoleType/Axis1" />
               <PropertyValue Property="DataPoint" AnnotationPath="@UI.DataPoint#NumberOfSalesOrders" />
            </Record>
         </Collection>
      </PropertyValue>
   </Record>
</Annotation>ABAP CDS Annotation
@UI.Chart: [
  {
    title: 'Sales Orders by Status',
    description: 'Number of Sales Orders by Status',
    chartType: #DONUT,
    dimensions: [
      'SALESORDEROVERALLSTATUS'
    ],
    dimensionAttributes: [
      {
        dimension: 'SalesOrderOverallStatus',
        role: #CATEGORY
      }
    ],
    measures: [
      'NUMBEROFSALESORDERS'
    ],
    measureAttributes: [
      {
        measure: 'NumberOfSalesOrders',
        role: #AXIS_1,
		asDataPoint: true
      }
    ],
    qualifier: 'FilterNumberOfSalesOrdersByStatus'
  }
]
annotate view VIEWNAME with {

}
CAP CDS Annotation
UI.Chart #FilterNumberOfSalesOrdersByStatus : {
    $Type : 'UI.ChartDefinitionType',
    Title : 'Sales Orders by Status',
    Description : 'Number of Sales Orders by Status',
    ChartType : #Donut,
    Dimensions : [
        SalesOrderOverallStatus
    ],
    DimensionAttributes : [
        {
            $Type : 'UI.ChartDimensionAttributeType',
            Dimension : SalesOrderOverallStatus,
            Role : #Category
        }
    ],
    Measures : [
        NumberOfSalesOrders
    ],
    MeasureAttributes : [
        {
            $Type : 'UI.ChartMeasureAttributeType',
            Measure : NumberOfSalesOrders,
            Role : #Axis1,
            DataPoint : '@UI.DataPoint#NumberOfSalesOrders'
        }
    ]
}
Annotation: SelectionFields
Define the SelectionFields annotation for sorting the order of the fields displayed in the visual filters. If there are any mandatory filter
fields that
aren't
specified in the SelectionFields, then these fields appear first, followed by the other entries in the
SelectionFields.
XML Annotation
<Annotation Term="UI.SelectionFields">
  <Collection>
    <PropertyPath>DeliveryCalendarYear</PropertyPath>
    <PropertyPath>SoldToParty</PropertyPath>
    <PropertyPath>Product</PropertyPath>
    <PropertyPath>MainProductCategory</PropertyPath>
    <PropertyPath>DeliveryCalendarQuarter</PropertyPath>
  </Collection>
</Annotation>ABAP CDS Annotation
@UI.SelectionField: [{ position: 10 }]
DELIVERYCALENDARYEAR;

@UI.SelectionField: [{ position: 20 }]
SOLDTOPARTY;

@UI.SelectionField: [{ position: 30 }]
PRODUCT;

@UI.SelectionField: [{ position: 40 }]
MAINPRODUCTCATEGORY;

@UI.SelectionField: [{ position: 50 }]
DELIVERYCALENDARQUARTER;CAP CDS Annotation
UI.SelectionFields : [
    DeliveryCalendarYear,
    SoldToParty,
    Product,
    MainProductCategory,
    DeliveryCalendarQuarter
]
Annotation: SelectionVariant
XML Annotation
<Annotation Term="UI.SelectionVariant" Qualifier="SVForStatus">
   <Record>
      <PropertyValue Property="Parameters">
         <Collection>
            <Record Type="UI.Parameter">
               <PropertyValue Property="PropertyName" PropertyPath="CompanyCurrency" />
               <PropertyValue Property="PropertyValue" String="EUR" />
            </Record>
         </Collection>
      </PropertyValue>
      <PropertyValue Property="SelectOptions">
         <Collection>
            <Record Type="UI.SelectOptionType">
               <PropertyValue Property="PropertyName" PropertyPath="SalesOrderOverallStatus" />
               <PropertyValue Property="Ranges">
                  <Collection>
                     <Record Type="UI.SelectionRangeType">
                        <PropertyValue EnumMember="UI.SelectionRangeSignType/E" Property="Sign" />
                        <PropertyValue EnumMember="UI.SelectionRangeOptionType/EQ" Property="Option" />
                        <PropertyValue Property="Low" String="D" />
                     </Record>
                  </Collection>
               </PropertyValue>
            </Record>
            <Record Type="UI.SelectOptionType">
               <PropertyValue Property="PropertyName" PropertyPath="Product" />
               <PropertyValue Property="Ranges">
                  <Collection>
                     <Record Type="UI.SelectionRangeType">
                        <PropertyValue EnumMember="UI.SelectionRangeSignType/E" Property="Sign" />
                        <PropertyValue EnumMember="UI.SelectionRangeOptionType/EQ" Property="Option" />
                        <PropertyValue Property="Low" String="HT-1502" />
                     </Record>
                  </Collection>
               </PropertyValue>
            </Record>
         </Collection>
      </PropertyValue>
   </Record>
</Annotation>ABAP CDS Annotation
@UI.selectionVariant: [
  {
    qualifier: 'SVForStatus',
	parameters: [{name: 'PropertyName', value: 'CompanyCurrency' },{ name: 'PropertyValue', value: 'EUR'}]
  }
]
CAP CDS Annotation
UI.SelectionVariant #SVForStatus : {
    Parameters : [
        {
            $Type : 'UI.Parameter',
            PropertyName : CompanyCurrency,
            PropertyValue : 'EUR'
        }
    ],
    SelectOptions : [
        {
            $Type : 'UI.SelectOptionType',
            PropertyName : SalesOrderOverallStatus,
            Ranges : [
                {
                    $Type : 'UI.SelectionRangeType',
                    Sign : #E,
                    Option : #EQ,
                    Low : 'D'
                }
            ]
        },
        {
            $Type : 'UI.SelectOptionType',
            PropertyName : Product,
            Ranges : [
                {
                    $Type : 'UI.SelectionRangeType',
                    Sign : #E,
                    Option : #EQ,
                    Low : 'HT-1502'
                }
            ]
        }
    ]
}
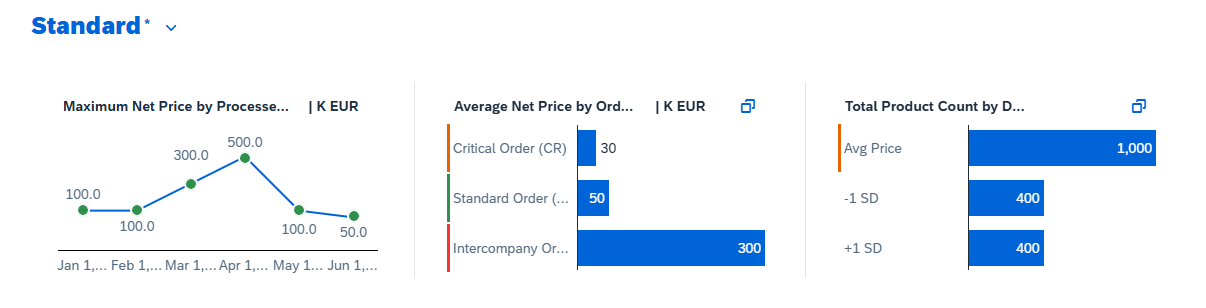
Charts
Chart Type
You can select chart data points and segments in a chart. These selections influence the other chart filters depending on the configuration of the value list annotation.
|
The Chart Type… |
Displays… |
|---|---|
|
Bar |
Top or bottom three records |
|
Line |
First or last six data points |
Donut (Only supported in SAP Fiori elements for OData V2) |
Top or bottom two records |
In SAP Fiori elements for OData
V2, you can enable the visual filter (donut chart type) to display an overlay message if there are
measures with negative values. To do so, set the Analytics.AccumulativeMeasure annotation to false, as shown in the following
sample code. By default, the value of the Analytics.AccumulativeMeasure annotation is
true.
<Annotations Target="SEPMRA_ALP_SO_ANA_SRV.Z_SEPMRA_C_ALP_QUARTERVHType/DifferenceAmount">
    <Annotation Term="Analytics.Measure" Bool="true" />
    <Annotation Term="Analytics.AccumulativeMeasure" Bool="false" />
</Annotations>
Chart Title
Analytical list page displays chart titles in the following order:
<Measure Name> by <Dimension Name> in <Scale factor> <UoM>
- <Measure Name>: The measure associated with the chart. Use
sap:label() - <Dimension Name>: The dimension associated with the chart. Use
sap:label() -
<Scale Factor>: The scale specified using the
ScaleFactorproperty of theDataPointannotation associated with the measure displayed in the chart.Scale factor annotation
<Annotation Term="UI.DataPoint" Qualifier="LineChartTimeDataPoint">
    <Record Type="UI.DataPointType">
        <PropertyValue Property="Criticality" EnumMember="UI.CriticalityType/Positive"/>
        <PropertyValue Property="Title" String="Total Pricing"/>
        <PropertyValue Property="Value" Path="totalPricing"/>
        <PropertyValue Property="ValueFormat">
            <Record Type="UI.NumberFormat">
                <PropertyValue Property="ScaleFactor" Decimal="1000"/> // A value of 1000 results in "K" in the title bar since chart value is scaled with thousand!
            </Record>
        </PropertyValue>
    </Record>
</Annotation>
If not specified, SAP Fiori elements uses a built-in logic to determine the optimal scale factor for the values displayed in the chart.
SAP Fiori elements recommends that you do not specify a hard-coded scale factor that doesn't work well with changing measure values. Use it only if you can ensure that the range of possible values for the measure is fixed and there'sis a preferred scale factor to be used.
The scale factor in the chart and chart title are of the same scale.
Text Arrangement
You can modify the formatting of the text that appears on the visual filter chart axis labels, chart tooltips, and within the selected link (if a chart context is selected). The
default view of the visual filter bar is based on the filter fields defined in the TextArrangement annotation and its type in the main entity
set.
|
Text Arrangement Type |
Description |
|---|---|
|
TextFirst |
Use the visual filter to combine measures or item counts with filter values. The ChartDefault type that has the sap:text first, followed by the ID in brackets, for example, "Notebook (001)" |
|
TextLast |
ID followed by the sap:text in brackets, for example, "001 (Notebook)". |
|
TextOnly |
Shows only the sap:text, for example, "Notebook" |
|
TextSeparate |
Shows only the ID, for example, "002" |
XML Annotation
<Annotations Target="ProductType"> //Main EntitySet
  <Annotation Term="com.sap.vocabularies.UI.v1.TextArrangement" EnumMember="com.sap.vocabularies.UI.v1.TextArrangementType/TextFirst"/>
</Annotations>
ABAP CDS Annotation
@UI.textArrangement: #TEXT_FIRST
annotate view ProductType with {

}CAP CDS Annotation
annotate ProductType @(
  UI.TextArrangement : #TextFirst
);
Lazy Loading of Visual Filters
In SAP Fiori elements for OData
V2, you can enable lazy loading of visual filters by configuring the
lazyLoadVisualFilter setting in the descriptor file. It is disabled by default.
If lazy loading is enabled, then the batch call for loading of visual filters is deferred until the user switches to the visual filter bar.
Descriptor setting
"settings": {
              "qualifier": "MainContent",
              "defaultContentView": "charttable",
              "smartVariantManagement": true,
              "showGoButtonOnFilterBar": true,
              "multiSelect": true,
              "lazyLoadVisualFilter":true,
              "tableType": "AnalyticalTable",
              ....
}
In SAP Fiori elements for OData V4, lazy loading is enabled by default and can't be switched off.
Fixed Values on Visual Filters
To display default records on the visual filter chart, configure the SelectionVariant annotation with filter values (SelectOptions
property) and link it with the ValueList annotation.
The IN/OUT parameter values take precedence over the SelectionVariant values for the fields that have values coming from both
options.
Handling date-based filter fields
If the SelectionVariant has date-based filter fields, you must specify the value in the format "Z'. Ex:"2018-10-15T00:00:00Z",
with the time part as zeroes and appended with 'Z'.
In/Out Parameter Taking Precedence
|
Scenario |
Description |
|---|---|
|
Scenario 1: Annotation configuration Chart dimension = "Status", Select Option in SV = [("Status", Values = "In Progress", "New"), ("Project", Values="List Report")] |
|
|
Scenario 2: Overriding annotation configuration from filter bar Change the project value from |
Specifying Analytical List Page as a value for the project in the filter bar, re-renders charts to display records for In Progress and New status values of the Analytical List Page project.
The in/out parameter mapping values set for the other properties in the |
In SAP Fiori elements for OData
V2, you can render the visual filter with a parametrized entity set as the collection path.
To do so, you need to provide parameters in the SelectionVariant annotation. Any values added in the smart filter bar take priority over the
SelectionVariant annotation values.
|
Scenario |
Description |
|---|---|
|
Scenario 1: Annotation configuration Parameter in SelectionVariant = [("P_DisplayCurrency", Value="USD")] |
The chart renders records with the currency unit USD. |
|
Scenario 2: Overriding annotation configurations on the filter bar Change USD to EUR on the filter bar |
If you specify EUR as a value for |
Date Selection
Visual filters support date-based, single-select, multi-select based filter fields in the Universal Time Coordinated (UTC) format. Semantic dates and date ranges are not supported.
Unit of Measure with Multiple Units of Measure
Visual filter charts do not show up if the back end returns data with multiple units of measure (UoM). To achieve a single UoM, set the required UoM in the filter bar or change all the UoMs into one UoM in the back end.
For currency-based visual filter values, the currency value could come from another filter field in the main entity set (mapped to the value help currency field based entity set
through the standard IN mapping).
Semantic Coloring for Visual Filters Based on Dimension Values
Semantic coloring is based on the criticality defined in the ValueCriticality annotations for dimensions. The value returned from the path determines the color.
-
No color is applied to the chart dimension when a neutral value is returned.
-
Chart measure semantic coloring takes precendence over dimension semantic coloring.
For a sample annotation applicable to both SAP Fiori elements for OData V2 and SAP Fiori elements for OData V4, please see the Support for Criticality Coloring section in Configuring Charts.
Guidelines
Show the filter dimension with one measure in the visual filter not with multiple measures.
Filter dimensions in the regular filters (filter bar) have exactly one representation in the visual filter bar.
Do not show the same filter dimension with two or more different measures at the same time in the visual filter bar. The following example shows the Dimension
Year filter with two different measures Revenue and Quantity. Showing the filter
dimensionYear twice is not in sync with the regular filter, where it is shown only once. Furthermore, matching between the two filter
types won't work.
If the use case requires visualizing a dimension with different measures, consider using an overview page instead.
| Do | Don't |
|---|---|
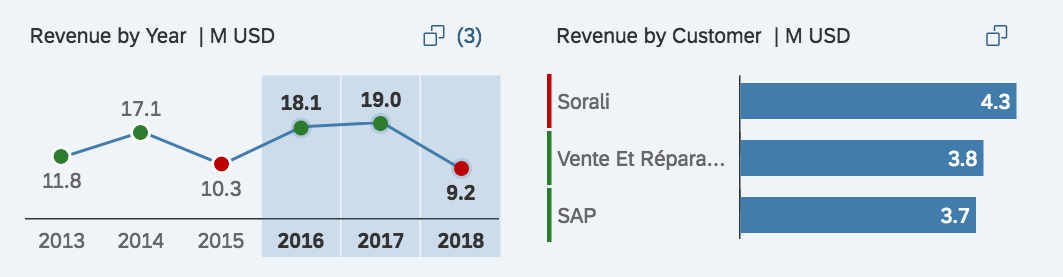 |
 |
| For each dimension, display exactly one representation in the visual filter bar. | Do not use the same filter dimension with different measures. |
We also support the visual filter setup for donut charts, and you can define visual filters for parameters.
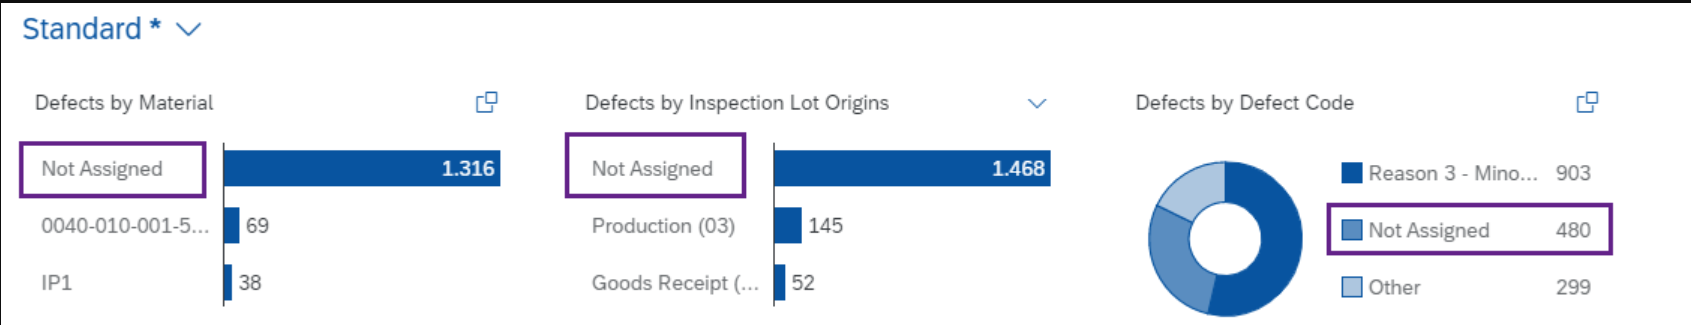
Display of Empty Values
In visual filter charts, the empty dimension value is displayed as Not Assigned. Note that this behavior is specific to the display of visual filters. For the value help, drop down, or compact filter, it is displayed as <empty>.
Date Selection
Visual filters support date-based, single selection fields in the Universal Time Coordinated (UTC) format. Visual filters also support string-based fields that denote a time period via the following annotations:
-
Edm.DateTimeandsap:display-format="Date" -
Edm.Stringandsap:semantics="yearmonthday" -
Edm.Stringandsap:semantics="yearmonth" -
Edm.Stringandsap:semantics="year" -
Edm.Stringandsap:semantics="yearquarter" -
Edm.Stringandsap:semantics="yearweek" -
Edm.Stringandsap:semantics="fiscalyear" -
Edm.Stringandsap:semantics="fiscalyearperiod"
Displaying the value in the visual filter and its tooltip is impacted. Value help or the dropdown for selecting the values remains the same if
sap:semantics="yearmonth" is set.
You can see the date selection button on the visual filter for fields annotated with sap:filter-restriction="single-value". For fields
annotated with sap:filter-restriction="multiple", you see the value help selection button.
Sample Metadata
<Property Name="StartDate" Type="Edm.DateTime" sap:display-format="Date"
sap:aggregation-role="dimension" sap:label="Date" sap:filter-restriction="single-value"/>

<Property Name="StartDate" Type="Edm.String" sap:semantics="yearmonthday"
sap:aggregation-role="dimension" sap:label="Date" sap:filter-restriction="single-value"/>
Number Formatting
The NumberOfFractionalDigits property is used to determine the number of fraction digits. NumberOfFractionalDigits information can be
provided in com.sap.vocabularies.UI.v1.DataPoint term, using the ValueFormat property.
These are the rules:
-
Decimals are not shown by default.
-
You can specify 1 or 2 decimal places using the
NumberOfFractionalDigitsproperty in annotations. If a value of more than 2 is provided, it is also included.
In the following sample code, the price property number of fractional digits provided in the OData metadata, 3 is overridden by the value 1 as provided in the com.sap.vocabularies.UI.v1.DataPoint
ValueFormat property:
XML Annotation
<Annotation Term="com.sap.vocabularies.UI.v1.DataPoint" Qualifier="Price">
    <Record Type="com.sap.vocabularies.UI.v1.DataPointType">
        <PropertyValue Property="Value" Path="Price"/>
        <PropertyValue Property="ValueFormat">
            <Record Type="com.sap.vocabularies.UI.v1.NumberFormat">
                <PropertyValue Property="NumberOfFractionalDigits" Int="1"/>
            </Record>
        </PropertyValue>
    </Record>
</Annotation>
ABAP CDS Annotation
@UI.dataPoint: {
   valueFormat.numberOfFractionalDigits: 1
}
price;
Semantic Coloring for Visual Filters Based on Measure Values
Semantic coloring is based on the defined:
-
Criticality in
DataPointannotations. The specified value, or the value returned from a path, determines the color -
CriticalityCalculationinDataPointannotations, along with the improvement direction and various threshold values. This applies only when the criticality is not defined.
No color is applied to the chart measure when:
-
A neutral value is returned.
-
Not enough threshold values are defined or when the improvement direction is missing.
Grouping Visual Filter Calls (Optional)
You can add groupId for a set of visual filters to consolidate all group calls into one batch call. This allows you to group fast-loading visual filters in
one batch and group all the other slow loading visual filters into a separate batch call. This improves rendering of the fast-loading visual filters over the
slow-loading visual filters.
Define the onBeforeRebindVisualFilterExtension extension controller method in the controller file. Ensure that the groupId is
one of the keys in the oContext object which is passed to the extension as a parameter. Provide a valid string value as shown here:
onBeforeRebindVisualFilterExtension: function(sEntityType, sDimension, sMeasure, oContext){
    'use strict';
    var Log = sap.ui.require("sap/base/Log");
    if (sDimension === "Product") {
        oContext.groupId = "Group1";
    }
    if (sDimension === "DeliveryCalendarMonth" || sDimension === "DeliveryCalendarQuarter") {
        oContext.groupId = "Group2";
    }
    Log.info("onBeforeRebindVisualFilterExtension called!");
}
-
The visual filter calls without a
groupIdare all combined in one batch. -
Visual filter calls assigned to a
groupIdreach the back end in one batch.
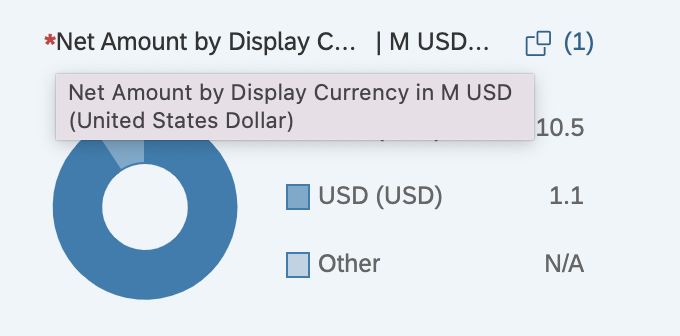
Text for Unit of Measure
If a unit field such as a currency or unit of measure(UOM) contains a text annotation (sap:text) this property is retrieved and displayed along with the
unit field.
The unit fields can contain the text annotation either in the main entity set or its value list entity sets.
Main Entity Set: DisplayCurrency doesn't contain a text
annotation
<EntityType Name="ZEPM_C_SALESORDERITEMQUERYResult" sap:semantics="aggregate" sap:content-version="1">
                <Key>
                    <PropertyRef Name="ID"/>
                </Key>
              <Property Name="DisplayCurrency" Type="Edm.String" MaxLength="5" sap:aggregation-role="dimension" sap:creatable="false" sap:label="Display Currency" sap:updatable="false" sap:semantics="currency-code"/>
</EntityType >
Value List Entity Set : DisplayCurrency contains a text annotation to another text
property
<EntityType Name="ZEPM_C_SALESORDERITEMQUERYValueHelpResult" sap:semantics="aggregate" sap:content-version="1">
                <Key>
                    <PropertyRef Name="ID"/>
                </Key>
                <Property Name="DisplayCurrency" Type="Edm.String" MaxLength="5" sap:aggregation-role="dimension" sap:creatable="false" sap:label="Display Currency" sap:updatable="false" sap:semantics="currency-code" sap:text="DisplayCurrencyText"/>
                <Property Name="DisplayCurrencyText" Type="Edm.String" MaxLength="60" sap:filterable="false"/>
</EntityType >
The text is fetched to be displayed along with the unit field and is displayed in brackets.
If the main entity set doesn't contain the text annotation, and if the unit field has a value list associated, and the text annotation is present in the value list entity set, then this is retrieved and displayed along with the unit field.
If the main entity set contains the text annotation for a unit, then that is displayed and the value list entity set is not checked for the annotation.
You must ensure there is a manifest property for each visual filter that is to be rendered. For more information, see the Additional Features in SAP Fiori Elements for OData V4 section in Configuring the Visual Filter Bar.
Line Chart
Line charts are only rendered if the dimension is time-based, that is, if you use Edm.Date, Edm.Time, or
Edm.DateTimeOffset.
Date Selection
While date/time is converted to the local timezone, the values coming from the back end are used for all other formats. SAP Fiori elements for OData
V4
Edm.Date, which is shown with no conversion to the local timezone.
Number Formatting
The NumberOfFractionalDigits property is used to determine the number of fraction digits. NumberOfFractionalDigits information can be provided
in com.sap.vocabularies.UI.v1.DataPoint term, using the ValueFormat property. These are
the rules:
-
Decimals are not shown by default.
-
You can specify 1 or 2 decimal places using the
NumberOfFractionalDigitsproperty in annotations. If a value of more than 2 is provided, it remains at 2.For a currency-based measure, the number of decimal places as specified in the annotation is only considered if the measure value is also being displayed with a scale factor. Otherwise, the number of decimal places is based on the displayed currency.
In the following sample code, the weight property number of fractional digits provided in the OData metadata, is set to the value 1 as provided in the com.sap.vocabularies.UI.v1.DataPoint
ValueFormat property:
XML Annotation
<Annotation Term="com.sap.vocabularies.UI.v1.DataPoint" Qualifier="Weight">
    <Record Type="com.sap.vocabularies.UI.v1.DataPointType">
        <PropertyValue Property="Value" Path="Weight"/>
        <PropertyValue Property="ValueFormat">
            <Record Type="com.sap.vocabularies.UI.v1.NumberFormat">
                <PropertyValue Property="NumberOfFractionalDigits" Int="1"/>
            </Record>
        </PropertyValue>
    </Record>
</Annotation>
ABAP CDS Annotation
@UI.dataPoint: {
   valueFormat.numberOfFractionalDigits: 1
}
price;CAP CDS Annotation
UI.DataPoint #Price : {
    $Type : 'UI.DataPointType',
    Value : Price,
    ValueFormat : {
        $Type : 'UI.NumberFormat',
        NumberOfFractionalDigits : 1
    }
}
Semantic Coloring for Visual Filters Based on Measure Values
We support only hard-coded values. Ensure that a data point has been defined for the measure of the chart and that the criticality has been configured for the data point.
No color is applied to the chart measure when a neutral value is returned.
Chart coloring specified on dimensions using semantic coloring is overridden by the semantic coloring specified for the measures.
XML Annotation
<Annotation Term="UI.Chart" Qualifier="BarChartSoldToParty">
     <Record Type="UI.ChartDefinitionType">
          <PropertyValue Property="Title" String="Bar Chart"/>
          <PropertyValue Property="Description" String="Testing Bar Chart"/>
          <PropertyValue Property="ChartType" EnumMember="UI.ChartType/Bar"/>
          <PropertyValue Property="Measures">
               <Collection>
                    <PropertyPath>totalPricing</PropertyPath>
               </Collection>
          </PropertyValue>
          <PropertyValue Property="Dimensions">
               <Collection>
          <PropertyPath>SoldToParty</PropertyPath>
               </Collection>
          </PropertyValue>
          <PropertyValue Property="MeasureAttributes">
               <Collection>
                    <Record Type="UI.ChartMeasureAttributeType">
                         <PropertyValue Property="Measure" PropertyPath=" totalPricing"/>
                         <PropertyValue Property="Role" EnumMember="UI.ChartMeasureRoleType/Axis1"/>
                         <PropertyValue Property="DataPoint" AnnotationPath="@UI.DataPoint#LineChartTimeDataPoint"/>
                    </Record>
               </Collection>
          </PropertyValue>
          <PropertyValue Property="DimensionAttributes">
               <Collection/>
          </PropertyValue>
     </Record>
</Annotation>

<Annotation Term="UI.DataPoint" Qualifier="LineChartTimeDataPoint">
     <Record Type="UI.DataPointType">
          <PropertyValue Property="Value" Path="totalPricing"/>
          <PropertyValue Property="Title" String="Total Pricing"/>
          <PropertyValue Property="Criticality" EnumMember="UI.CriticalityType/Positive"/>
     </Record>
</Annotation>
ABAP CDS Annotation
@UI.chart: [
  {
    chartType: #BAR,
    title: 'Bar Chart',
    description: 'Testing Bar Chart',
    dimensions: [
      'SoldToParty'
    ],
    measures: [
      'totalPricing'
    ],
    measureAttributes: [{measure: 'totalPricing', role: #AXIS_1, asDataPoint: true }],
  }
]

@UI.dataPoint: {
     title: 'Total Pricing',
     criticalityValue: #POSITIVE
 }
totalPricing;
CAP CDS Annotation
Chart #BarChartSoldToParty               : {
            $Type             : 'UI.ChartDefinitionType',
            Title             : 'Bar Chart',
            Description       : 'Testing Bar Chart',
            ChartType         : #Bar,
            Measures          : [totalPricing],
            Dimensions        : [SoldToParty],
            MeasureAttributes : [{
                $Type     : 'UI.ChartMeasureAttributeType',
                Measure   : totalPricing,
                Role      : #Axis1,
                DataPoint : '@UI.DataPoint#LineChartTimeDataPoint'
            }],
DimensionAttributes: []
        },
        DataPoint #LineChartTimeDataPoint              : {
            Value       : totalPricing,
            Title       : 'Total Pricing',
            Criticality : #Positive,
            ValueFormat : {
                ScaleFactor: 1000
            }