sap.suite.ui.microchart
This library contains controls to visualize charts and diagrams that are lightweight and easy to use.
The following sections provide additional information for specific controls. For a complete list of all controls and their documentation, see API Reference and the Explored app.
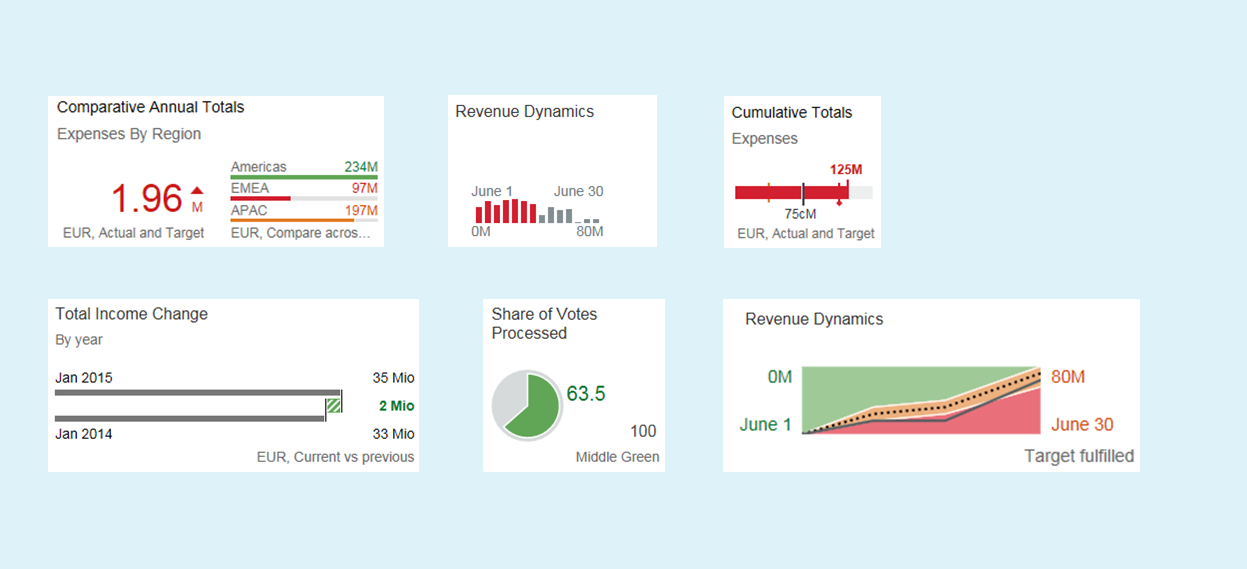
MicroCharts give a quick overview of customer-defined key figures like KPIs as graphical items and display the current status of defined key figures or thresholds.
The different values can be visualized in the charts by a semantically-colored representation. The different colors can be defined by the customer to correspond to the significance of the figures. For example, you can display critical statuses in red or you can display thresholds in specific colors to represent the significant values of your business data.
With the new sap.suite.ui.microchart library, all the available MicroChart controls of the sap.suite.ui.commons library have been moved to their own library with SAPUI5 version 1.34.
-
If you have already included a MicroChart control before SAPUI5 version 1.34, a wrapper ensures that the embedding still works for each control. To benefit from all the enhancements or new features for the MicroChart controls as of SAPUI5 1.34, you need to switch to the controls in the new library. With SAPUI5 1.34, all the MicroChart controls in the sap.suite.ui.commons library are marked as deprecated. The concerned controls are as follows:
- AreaMicroChart
- BulletMicroChart
- ColumnMicroChart
- ComparisonMicroChart
- DeltaMicroChart
- HarveyBallMicroChart
- During the move, the following controls and their elements have been renamed:
- MicroAreaChart to AreaMicroChart
- ComparisonChart to ComparisonMicroChart
- BulletChart to BulletMicroChart